Chaos Lab on iTunes
Chaos Lab is a fun educational app which is free for
download from the iTunes app store.
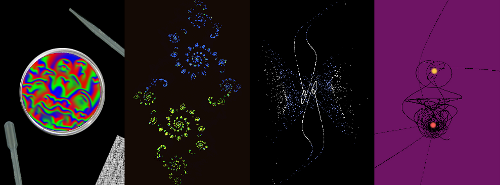
With a tilt of your device, you control the parameters of beautiful mathematical objects called strange attractors, the reaction rates of a chemical oscillator, the position of two stars in a 3-body chaos simulation, and the shape of the Julian fractal, with more experiments on the way in future
updates. |
OTHER PROGRAMSComing soon: MPI parallel programs related to thesis research, pending referee process of PRL submitted publication. |
QEMU-ready virtual image for research training on MPIA virtual image (i686, ubuntu-server 12.04) with MPI related software can be downloaded here. This zipped file is 718MB in size and expands to nearly 2GB. It is in the QCOW2 virtual image format and can be readily imported into XEN or KVM ready systems using the QEMU virtualization suite. The root and research user password are $+3xqa7h. This is an educational release for learning various parallelization methods in research. By downloading multiple copies and setting one as the server (a simple modification of the /etc/fstab file will do in terms of NFS, the user will have to modify /etc/hosts, /etc/hostname, and /home/research/.mpd.hosts accordingly), the user can quickly set up a virtualized parallel cluster to practice on and test code with. An example XML configuration file may be helpful. |
close_returns.cpp (2011)
Offering an alternative look at the close return plots introduced by Gilmore and Midlan (1992), this program
takes as input an x y z data set (any data, just name the file first.list) and produces a close return plot with x y z mapped to r g b colors
such that the darker the pixel, the closer the return. This has the effect of outlining some of the features that a black and white close
return map leave unclear. A sample for the Rossler: |
Bachaos (2011)The film Bachaos required a tremendous amount of storage space; this was for testing purposes and to enable the compilation of segments on more than one computer by storing the POV-Ray file for each frame, but if I were to repeat the making of this film on a single computer, I would instead only compile the POV-Ray file for each frame as it was needed, and then remove it, saving a substantial amount of space. With that said, here is the source code for the Thomas attractor scene from Bachaos. More source code will be posted in the near future. The text version of this Bach piece3, which is released by the rights holder under EFF:Open Audio License version 1, is here and is needed for the code to function properly, though it is not difficult to substitute other music or even not use music at all by modifying the code. To produce this data file from the original music file, one could use the *nix command:
sox music.wav -r 100 music.dat Once the frames (png) are compiled, they must be turned into film, which can be done, for example, with the *nix command: mencoder "mf://*.png" -mf fps=25 -o test.avi / -ovc lavc -lavcopts vcodec=msmpeg4:vbitrate=14400:vhq For the final film, multiple clips must be concatenated properly, and them the soundtrack layered in:
cat firstfile.avi secondfile.avi > concatenatedfile.avi

mencoder -o finalmovie.avi -noidx -oac copy /
               -ovc copy concatenatedfile.avi

mencoder -oac copy -ovc copy -o final.avi   /
             -audiofile bach.wav finalmovie.avi
|
makedf3.c (2011) Those wishing to use density files in
POV-Ray may find this useful; based on Paul Bourke's code but adapted
to work on Ubuntu, makedf3.c reads in a set of
x y z points and assigns them a random density based on a random input
file. The results of this can be see here
|
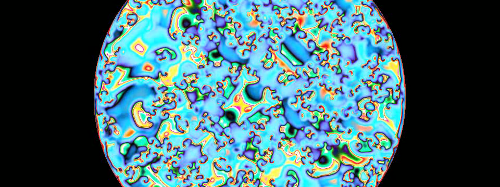
willamowski_rossler.c (2010)
Willamowski-Rössler reaction-diffusion equations are modeled in this code as a
partial replication of work done by Goryachev and Kapral in Physical Review Letters, Volume 76, Number 10, 1619 (4 March 1996). This representation differs in that the concentrations (c_x, c_y, c_z) are here represented by the colors red, green, and blue respectively, as normalized by taking their difference (absolute value of) from the center pixel and dividing by the center pixel's value (maximal value = 1). The simulation is done in 2D circular numerical simulacrum of a petri dish with zero-reaction rate boundary conditions on the edge of the dish. A simpler Euler integration is done, though
more sophisticated adaptions with GSL are possible. The free library pngwriter is used
to output png files. The final result can be seen here.
|
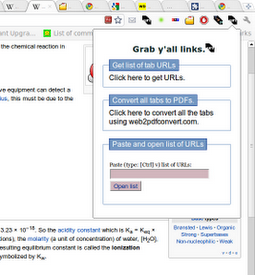
yalllinks.crx (2010)In conducting research, I often end up with a dozen or more tabs open in my Google Chrome browser. If I want to continue this research thread at home, I would have to copy and paste each url indvidually. Since I couldn't find an extension that would gather the tab urls in one place, I wrote "Grab y'all links". You can download version 1.0 here. All of your tab links in Chrome will be listed in a javascript popup which you can then copy and paste into an e-mail for later reference. At a second desktop, you can then copy these links from your e-mail and paste them into the extension, which will automagically open all of the the URLs to recreate your prior browsing session.
Weather_philly.crx (2011)Residents of Philadelphia and the nearby regions can also make use of a weather extension I wrote, which puts a green dot on their Chrome extension bar; by pressing this dot, the user gets an instant radar image covering the region from weather.com, which can be animated to show potential storm direction. Since this extension makes use of weather.com radar images, I've chosen not to upload it to the Chrome store. The extension can be found here. Those who commute by bicycle may find this a particularly useful extension to get a quick look at the radar without having to pass through weather.com. Residents of other regions can easily modify the source-code of this extension by matching the proper radar link on weather.com with the link given in the source code. |
vanderpol_using_gsl.c (2010)Having finally made the leap from Numerical Recipes to GNU Scientific Library (GSL), this code uses GSL integrates the driven Van der Pol oscillator using a Runge-Kutta method that is more accurate than those offered by Numerical Recipes, and can be used by anybody in the world since GSL is open-source and free-to-use software. |
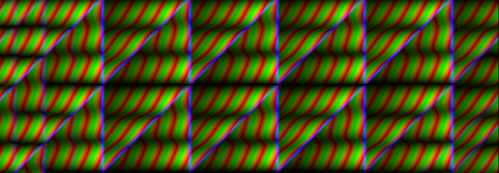
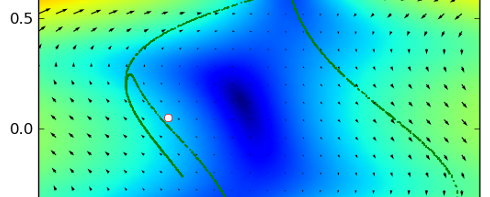
vander_field.py (2010)Matlab has some very useful and excellent
plotting capabilities. For Python, many of these functions can be
replicated using the matplotlib package. In this program, I plot
the vector field of a driven Van der Pol oscillator along with the
attractor itself and some points which will be explained in a future
publication. The color scheme is useful because the arrows in the
vector field are hard to visually detect when the vector field is weak,
and so I use a spectrum of colors to highlight this area. The code
can be found here and the results can
be found here.
|
poincare.pl (2010)This perl script takes a three column x-y-z file of data points for the Rossler attractor as input, and outputs the poincare section for each angle 2*Pi/700. This output is then used to create a simulation showing the sweep of the Poincare section through the Rossler. |
moon.pov (2010)Working with Dr. Arthur Congdon and using a solar system template created by Friedrich A. Lohmueller for POV-Ray, this POV-Ray code was written to provide an educational model for the phases of the moon. The .pov code and the .ini files will be needed for the animation. The resulting animation can be seen here. |
find.c (2009)Seeks and iterates periodic orbits up to given period for Rossler attractor. Based on identifying intersections with the x=y line on the first return map. (Not as efficient as a lattice refinement scheme). Due to Numerical Recipes copyright, a function of this code (Runge Kutta) is missing, but you can find alternative GNU versions at GSL. The truncated program is here. |
last_link_curve.c (2009)A companion to find.c, this program takes as input two files containing two separate curves from which an attempt at calculating the linking numbers is made. NOTE: This program is a work in progress; it works with smooth curves only, and occasionaly misses or double counts a link so use it at your own risk. The main program can be found here. It needs the following codes, vect.c which uses malloc to create a vector, mmatrix.c which uses malloc to create a matrix, and mreal.c which uses realloc to "grow" a matrix. |
chay_works.m/all.sh (2008)This Matlab code with corresponding shell code models the fast-subsystem of the Chay neurological model. Note: We use Matlab here for learning purposes, this model can be easily adopted to g++ and other free programming languages. A Maple worksheet is also available. |
fixed_hash.pl (2008)A perl script that takes epd files (A Chess library format) and converts them into Povray files for animation (see my Deep Blue page for the result). Demonstrates the use of hash in perl. I also used the pgn-extract program to get the games I programmed into epd format. |
interpolate.pl (2008)A quick simple perl script for doubling the size of a data file of point samples along a line. It uses simple interpolation between data points and can be found here. |
legol (2004)
LegoL is a prototype for a program that is intended to create canonical templates. This program is written in Python and requires a Python compilier and wxPython, all available as open source. It produces linear and cyclic canonical templates. Download the source here. Please note: c++ reads 8/3 as 2, but 1.0000*8/3 as 2.666 |
convert.pl (2007)A perl script for converting x,y,z data sets into Sp(x,y,z,r0) format for a POVRAY macro is here. |
sort.pl (2007)A perl script for sorting an x y z data file and then masking it can be found here. |
verify.c (2007)A stand-alone Lorentz attractor integrator which passes r from 28 to 60 by steps of 1 for simulation output is here. Demonstrates naming a file after a variable in c++. |
batching maple (2007)A short and not well articulated how-to giving an example of batching with Maple is given here. |
deal_data.pl (2007)An introductory code that processes a file with five columns, takes the last four columns of the last two rows, and calculates the pythagorian difference. |
nuseradd.pl (2004)There are surely better ways to do this, but a brute program that uses perl to interactively and more easily add users to a linux system can be found here. |
xmlfix.pl (2004)There are surely better ways to do this, but a brute program that uses perl to fix xml files made on windows so that linux servers can properly serve them and firefox can read them (uses sed) can be found here. |
animateNLD.pl (2004)There are surely better ways to do this, but a brute program that uses gifsicle and gnuplot to take a 3D data set and rotate it for a gif animation can be found here. |
get.pl (2005)There are surely better ways to do this, but a brute program that tried to clean up a calender output program for a more formalized output for further processing can be found here. |
rooster2.c (2005)There are surely better ways to do this, but a brute program that integrates the Rossler equations using rk4 routines can be found here. |
1.1.a.c (2005), 2.1.c (2005)
There are surely better ways to do this, but a brute program that
creates random numbers and bins them for a histogram and runs a /chi^2 test
can be found
here.
|
bifur1.c (2005), gnu.pl (2005)
There are surely better ways to do this, but a brute program that
computes values for the logistic map bifurcation diagram for graphing
can be found
here |
short.c (2005), f.c (2005)
There are surely better ways to do this, but a brute program that
outputs a data set that can be used to plot the cobweb diagram for
the logistic map can be found
here plot [0:3][-0.3:3] x, \"alpha.dat\" with points,\"ross.dat\" w l ls 2 |
pro1.c (2005), pro4.c (2005)
There are surely better ways to do this, but a brute program that
compares two random data sets and demonstrates that they are random
by statistical test can be found
here |
rotation.c (2006)
There are surely better ways to do this, but a brute program that
tries to demonstrate the Wolfgang Paul apparatus for demonstrating Mathieu's
equation/ rf-Paul trap concepts using openGL can be found
here |