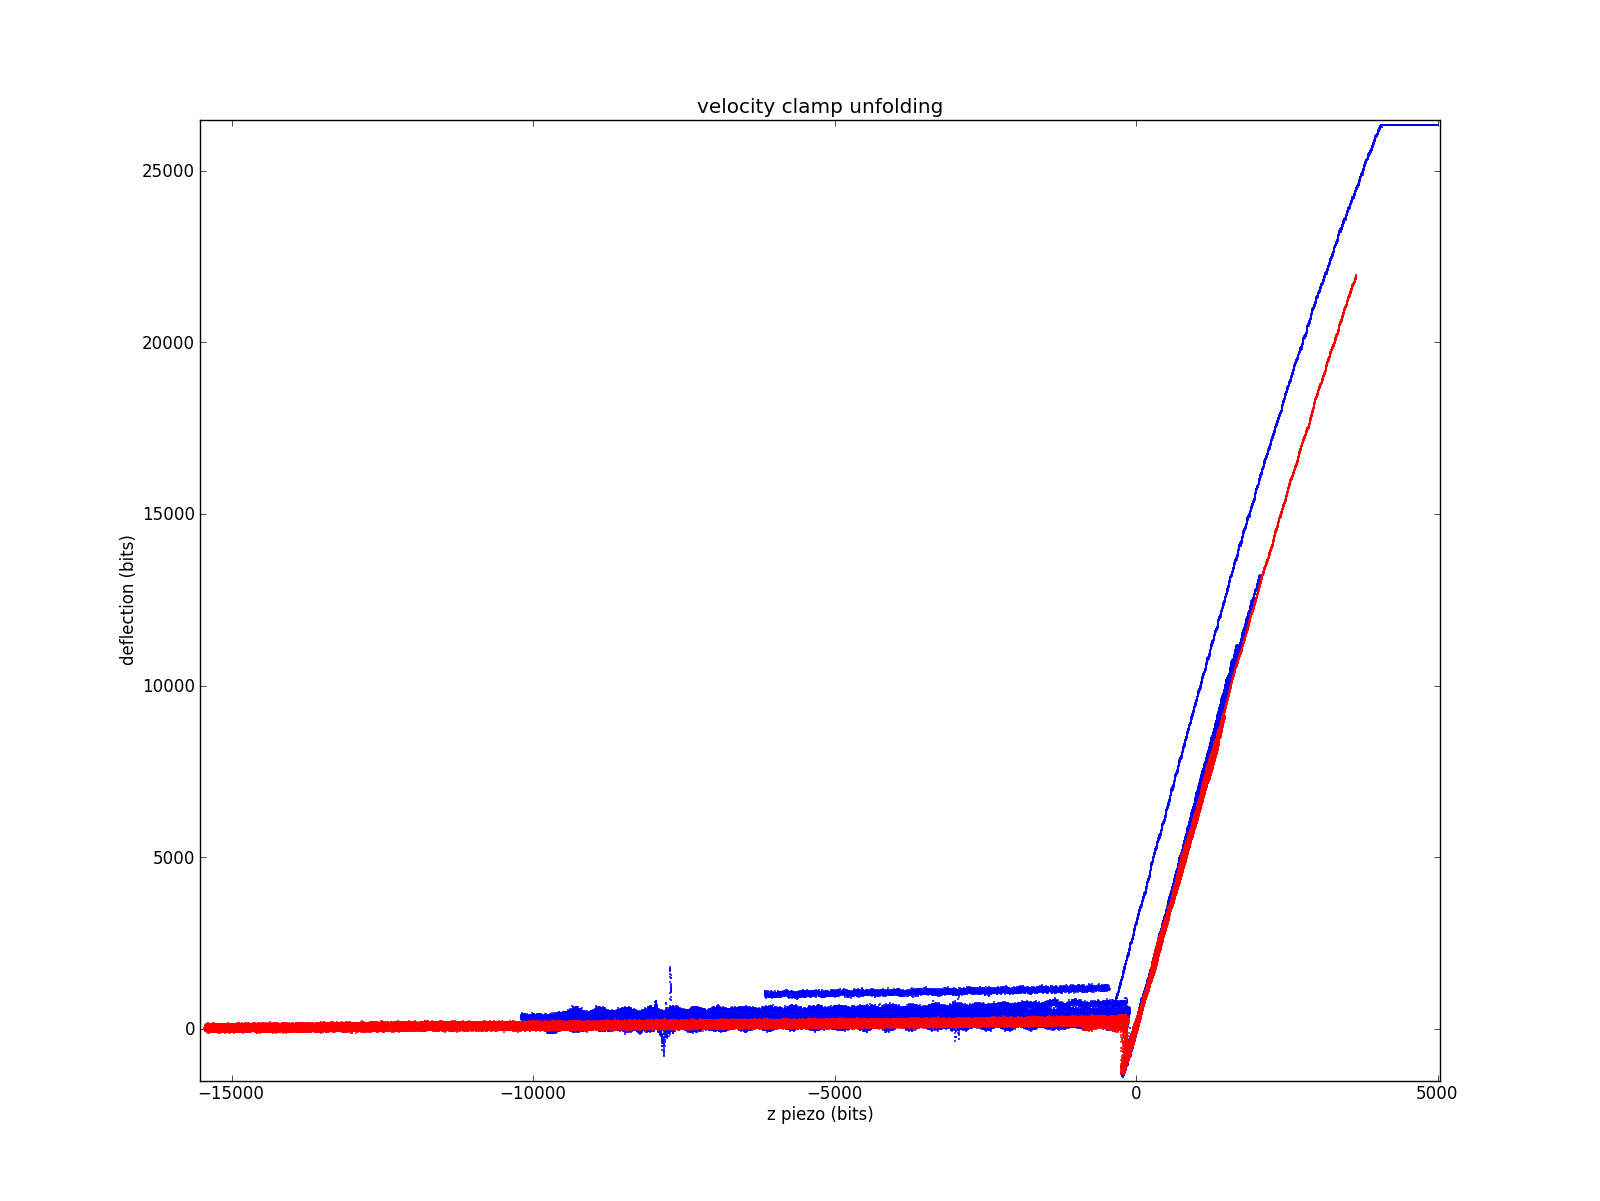
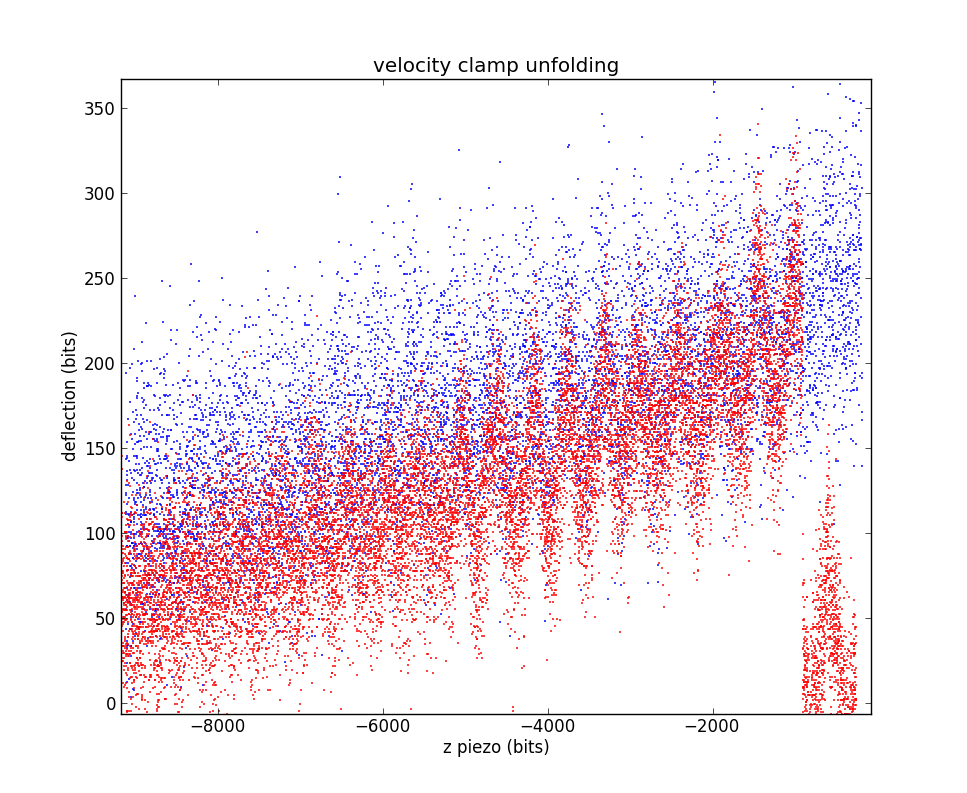
Plain water, no protein for both programs. LabVIEW data in blue, pyafm in red. LabVIEW data was taken immediately after the pyafm data without touching the microscope. Data has been shifted so the contact-kink is located near (0,0).
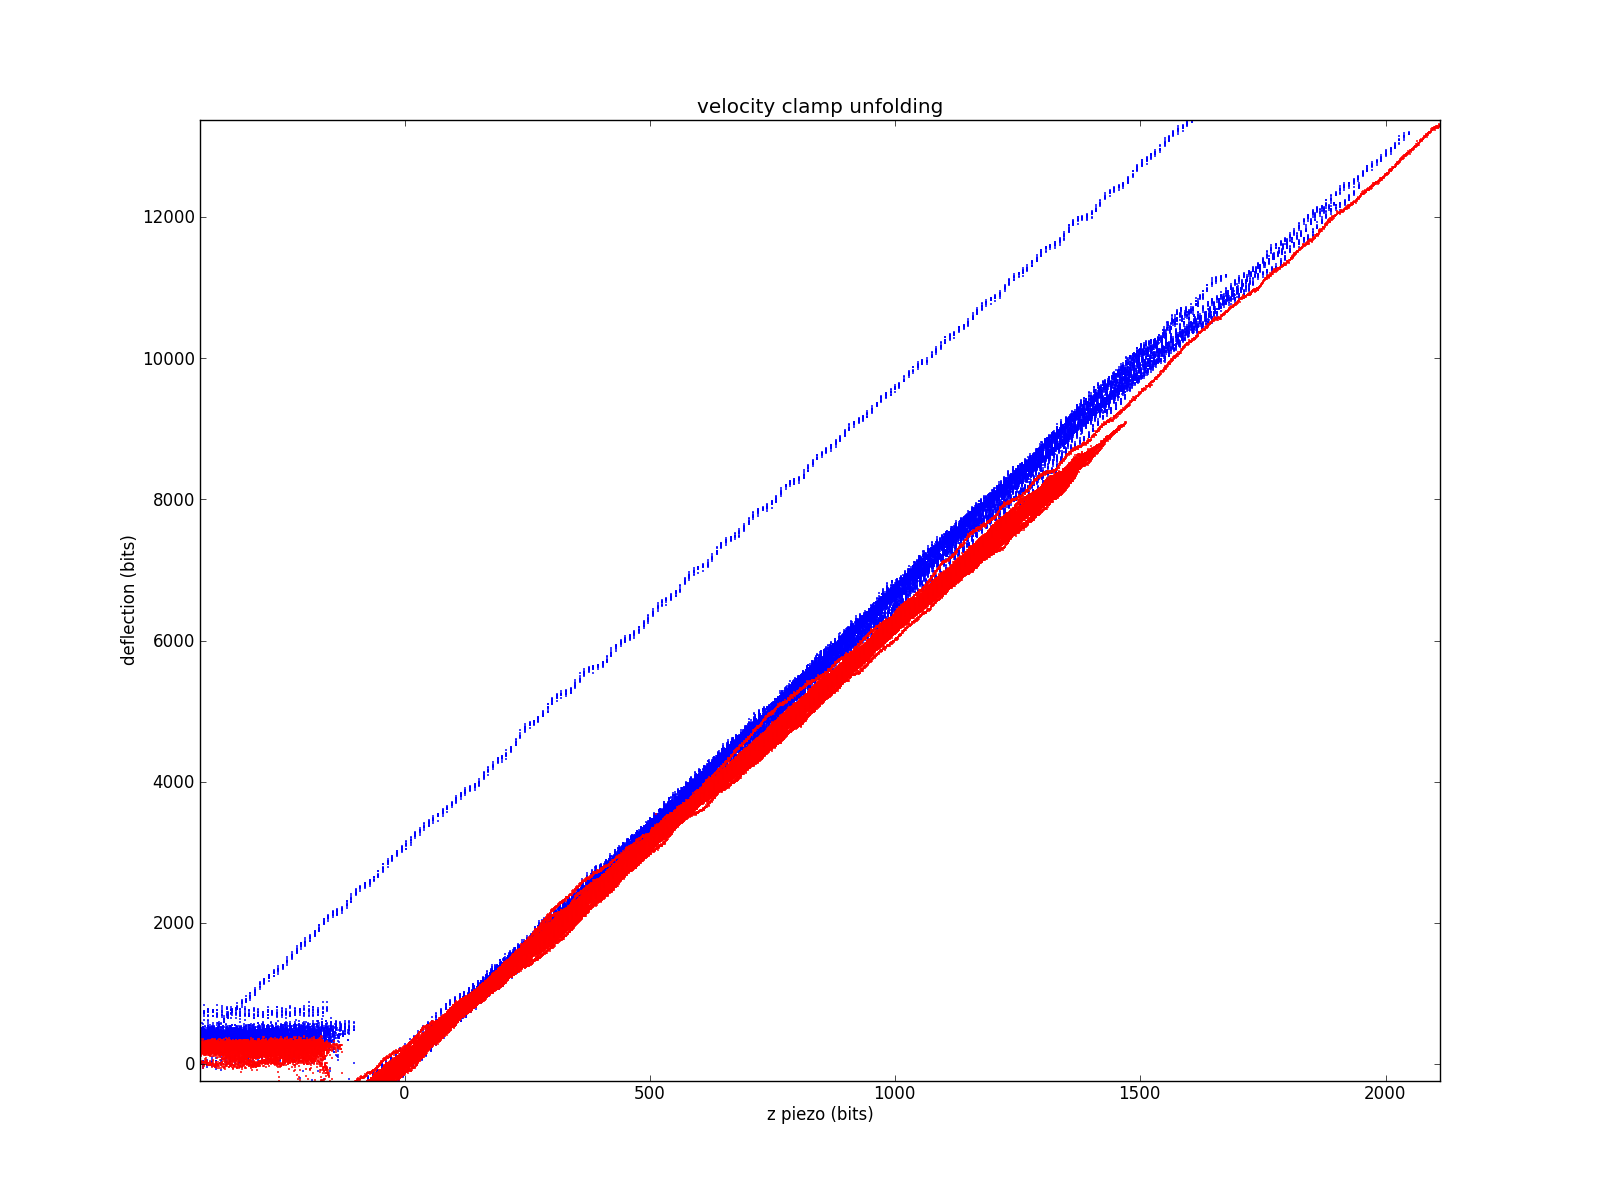
Focusing on the contact region. The fact that all the slopes are very similar suggests the two methods are grossly equivalent.
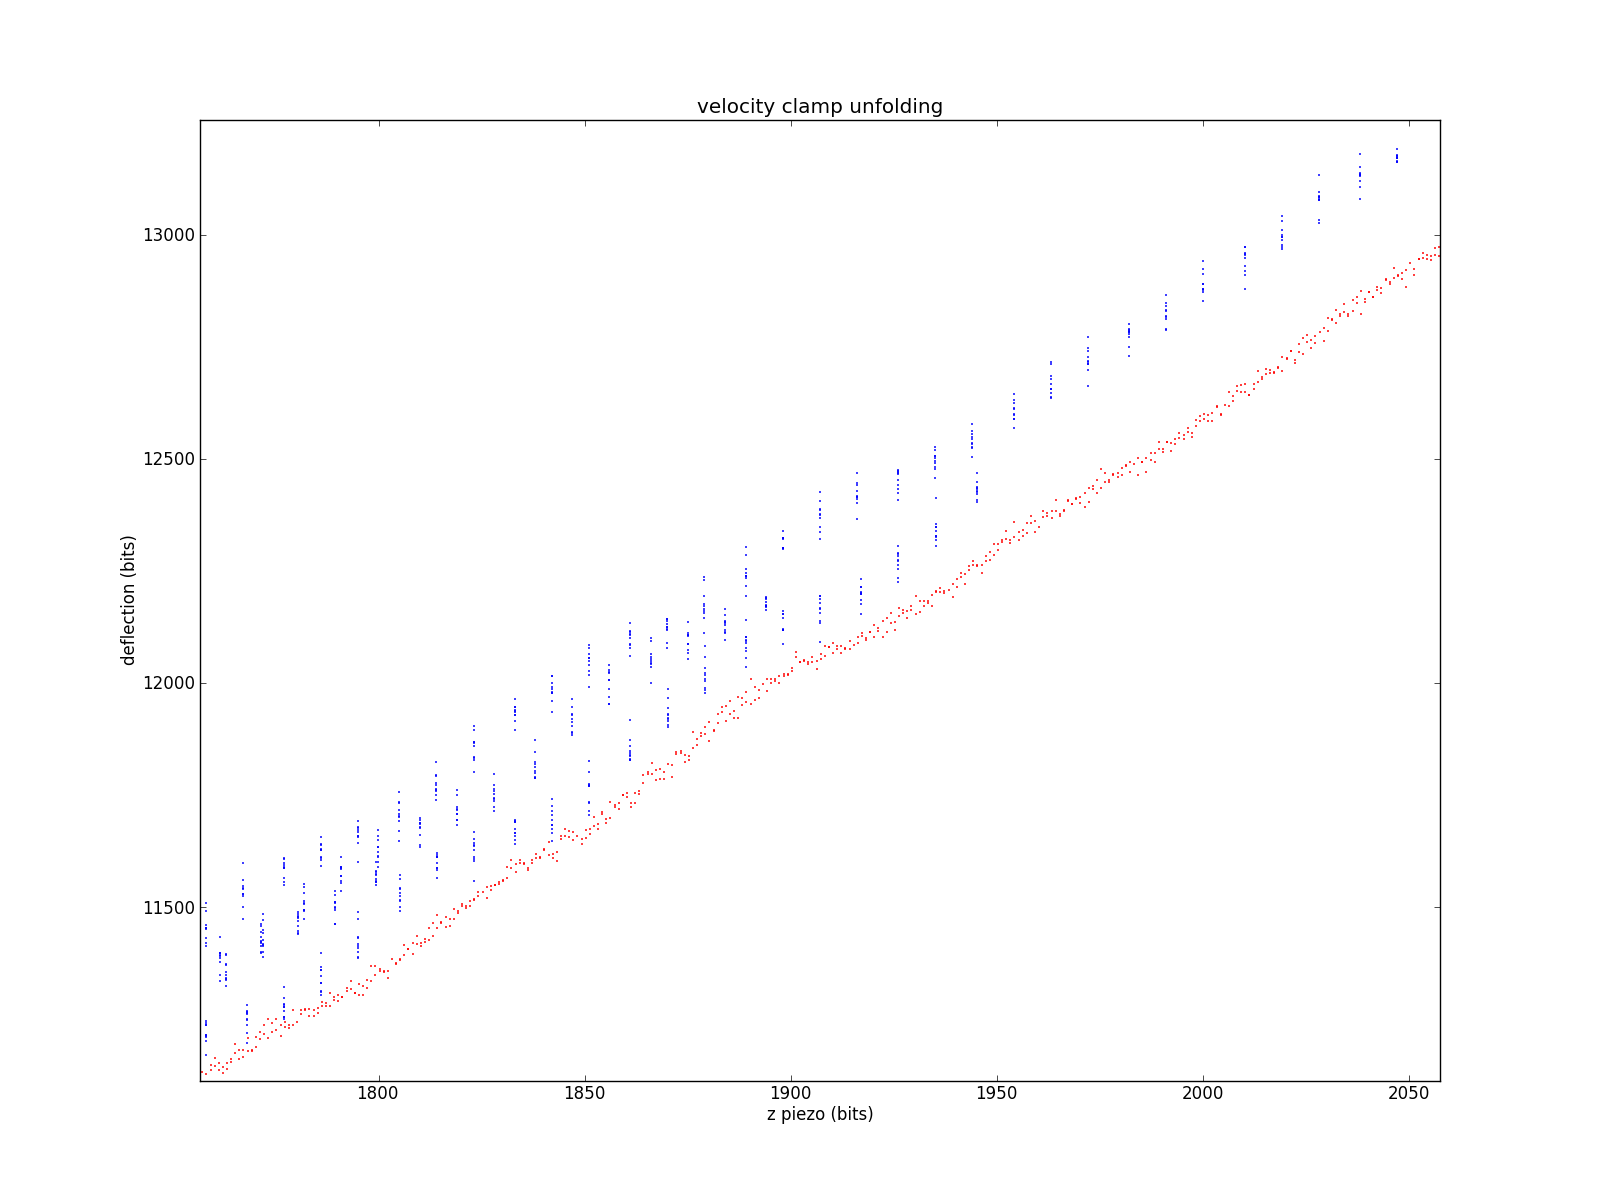
Zooming in to the very-high-contact region, where having lots of stacked cuves is less of an issue. You can see the discrete steps in the LabVIEW data.
Moving over to the non-contact region.
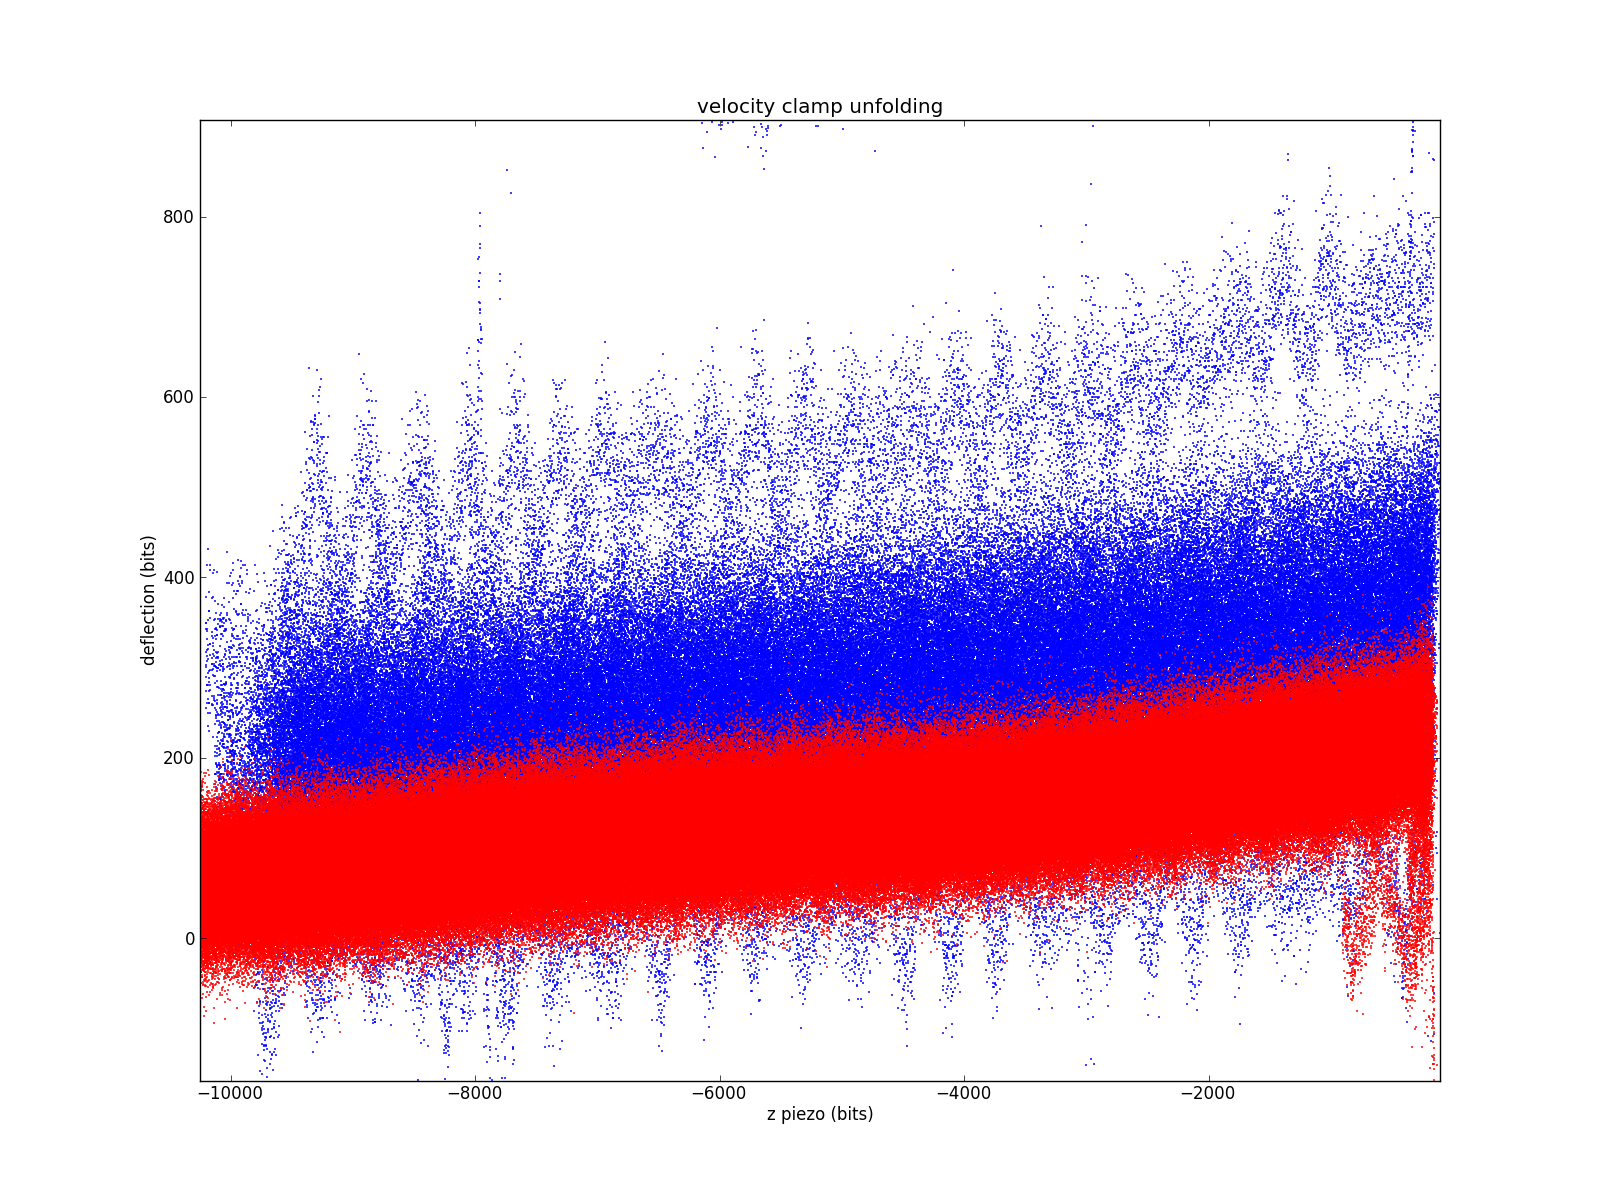
That's a little crowded, let's pick a single curve for each unfolder
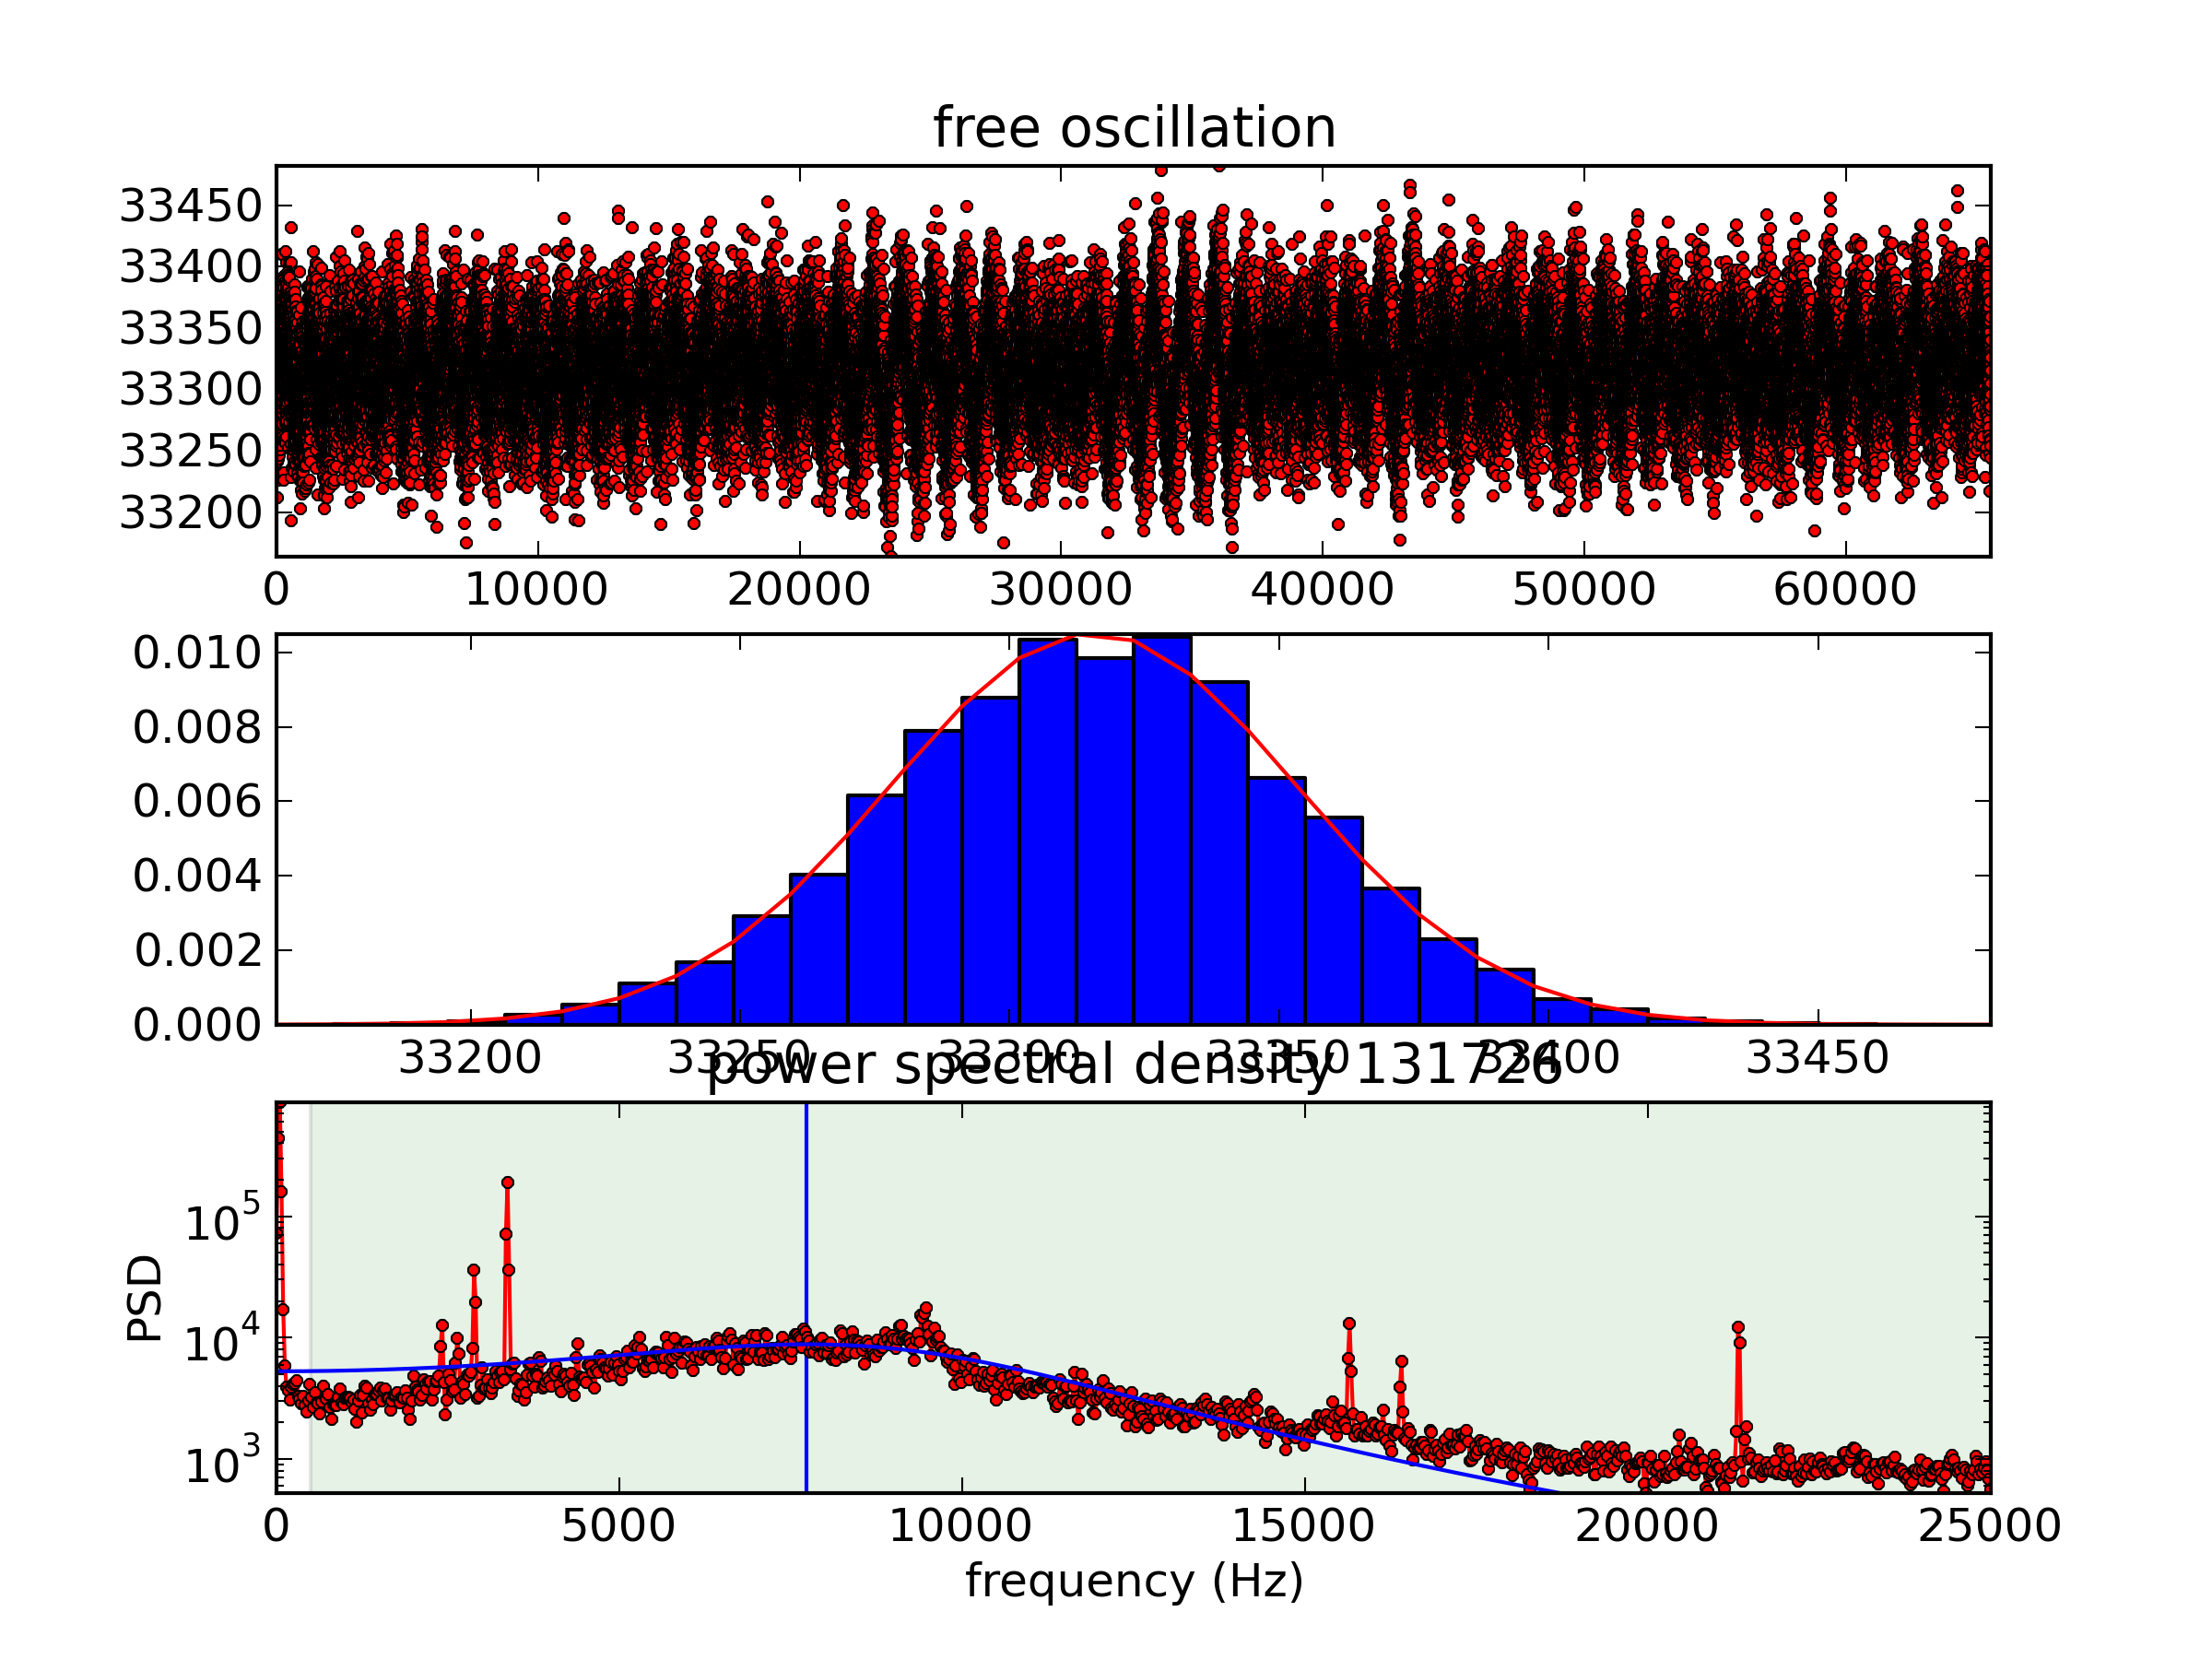
Hmm, there's a lot of vibration in each of those. Where is it coming from?
Vibration 15 from the 2012-10-01T16-51-15 calibcant run
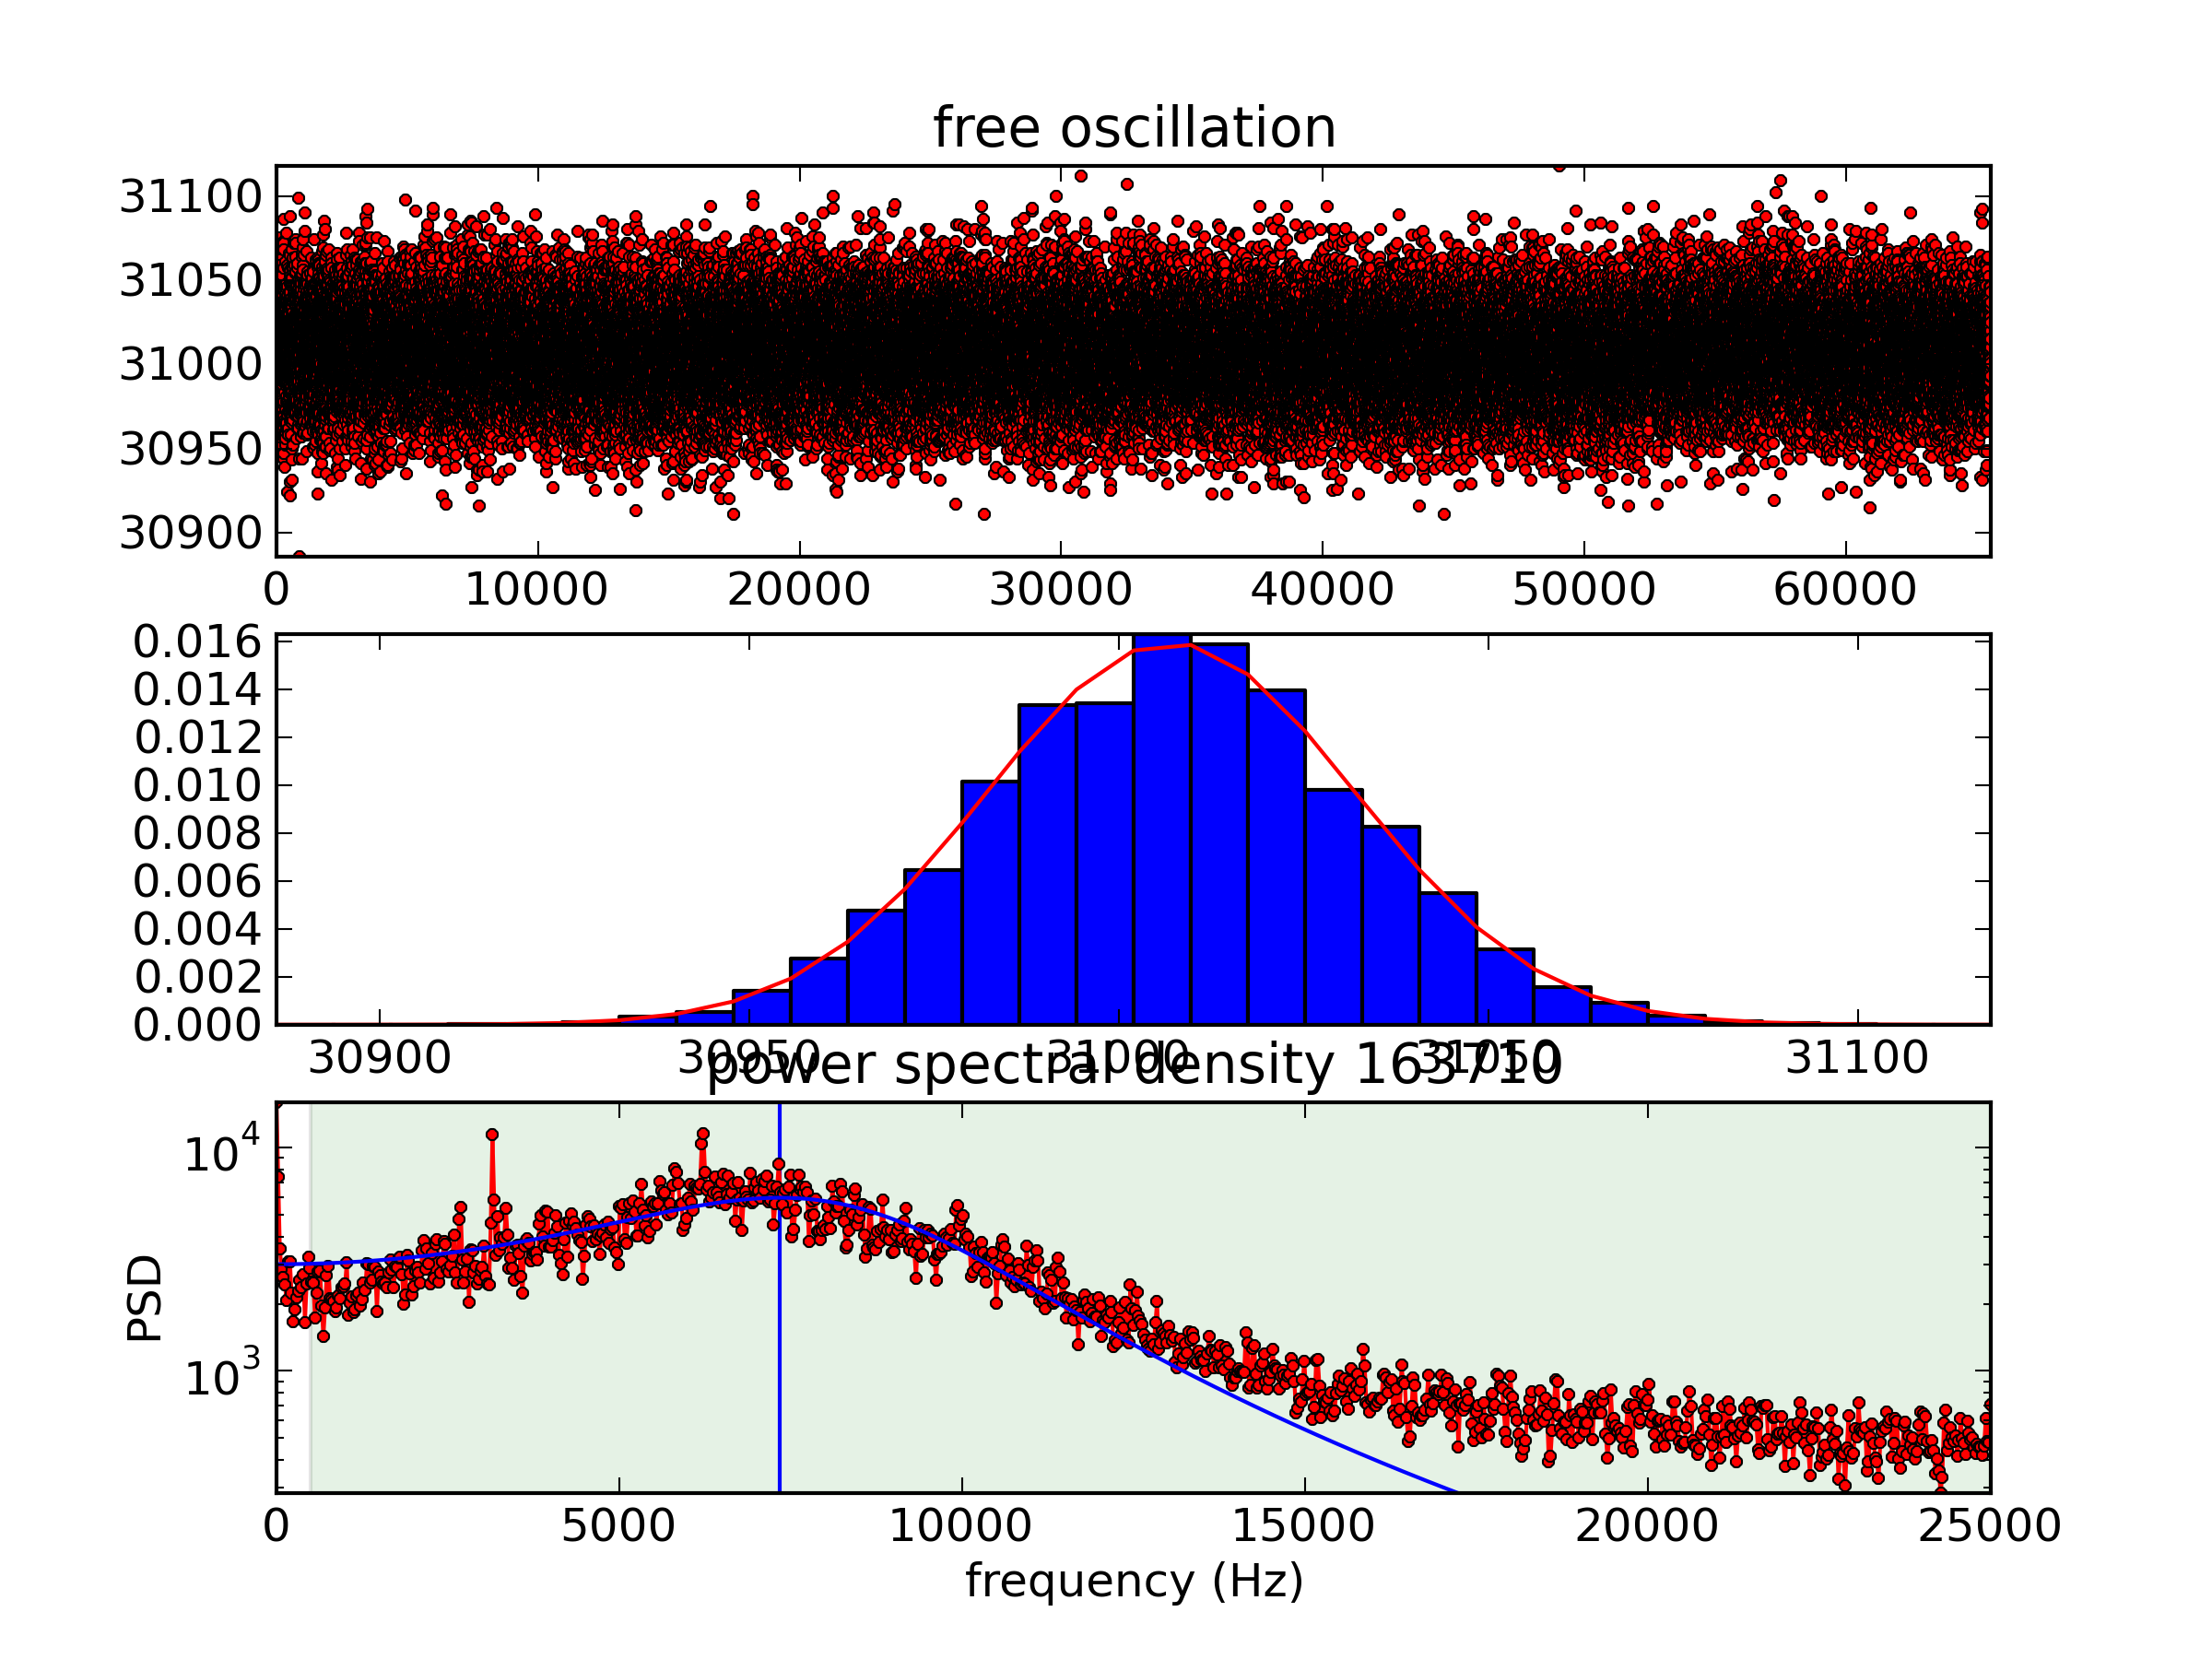
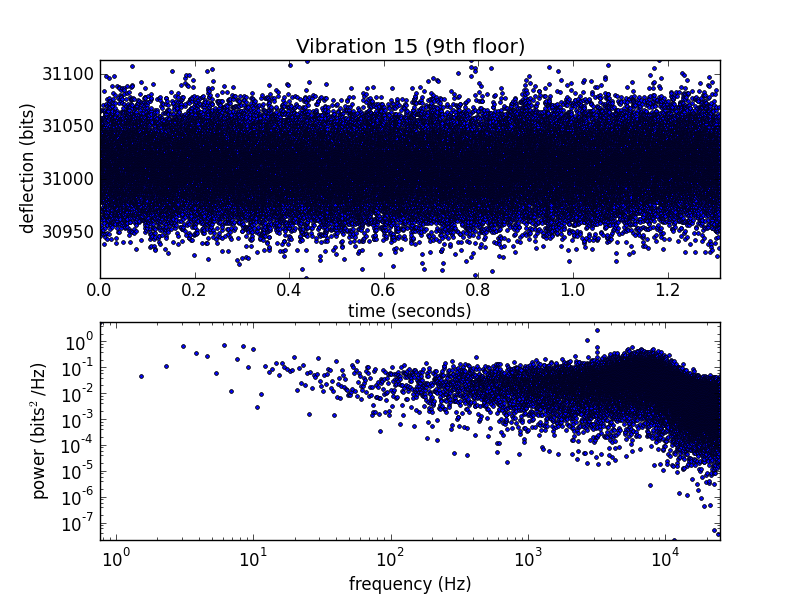
For comparison, here's the same measurement from when we were still on the 9th floor.
The 4th floor is clearly noisier, but the low-frequency wobble in the unfolding pulls is wedged up on the border of those plots. Let's use a log scale.
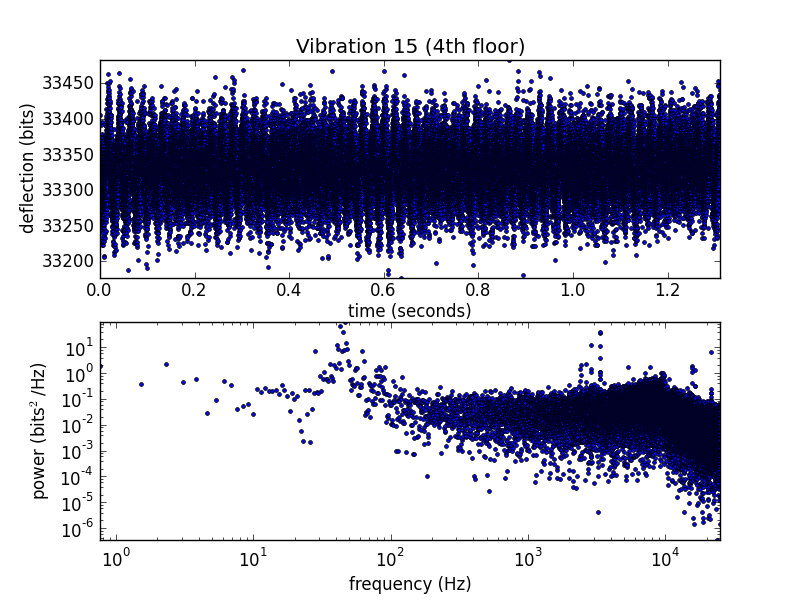
And the 9th-floor data on a log scale
Hmm, 50 Hz noise on the 4th floor. It's possible that this is from the wall power, but there are a lot of compressors running in that room. I'll try and get an audio recording to check their tone.